
Wing, Lift and Drag
Basic Aerofoil Terms
Chord Line
The chord line is defined as the straight line connecting the leading and trailing edges. The center of the leading-edge radius is located such that the cambered section projects slightly forward of the leading-edge point. The geometric angle of attack is the angle between the chord line and the direction of the undisturbed, “free-stream” flow. For many airplanes the chord lines of the airfoil sections are inclined relative to the vehicle axis.
Mean Camber Line
The locus of the points midway between the upper surface and the lower surface, as measured perpendicular to the chord line, defines the mean camber line. The shape of the mean camber line is very important in determining the aerodynamic characteristics of an airfoil section. Cambered airfoils in a subsonic flow generate lift even when the section angle of attack is zero. Thus, an effect of camber is a change in the zero-lift angle of attack, α . While the symmetric sections have zero lift at zero lift at zero angle of attack, zero lift results for sections with positive camber when they are at negative angles of attack.
Furthermore, camber has beneficial effect on the maximum value of the section lift coefficient. If the maximum lift coefficient is high, the stall speed will be low, all other factors being the same. It should be noted, however, that the thickness and camber necessary for high maximum values for the sections lift coefficient produce low critical Mach numbers and high twisting moments at high speeds. Thus, one needs to consider the trade-offs in selecting a design value for a particular parameter.
Maximum Thickness and Thickness Distribution
The maximum thickness and the thickness distribution strongly influence the aerodynamic characteristics of the airfoil section. The maximum lift coefficient for an airfoil section increases as the maximum thickness of the airfoil increases. In addition the thicker airfoils benefit more from the use of high lift devices but have a lower critical Mach number. The maximum local velocity to which a fluid particle accelerates as it flows around an airfoil section increases as the maximum thickness increases.
Thus, the minimum pressure value is smallest for the thickest airfoil. As a result, the adverse pressure gradient associated with the deceleration of the flow from the location of this pressure minimum to the trailing edge is greatest for the thickest airfoil. As adverse pressure gradient becomes larger, the boundary layer becomes thicker (and is more likely to separate producing relatively large values for the form drag). Thus, the beneficial effects of increasing the maximum thickness are limited.
The thickness distribution for an airfoil affects the pressure distribution and the character of the boundary layer. As the location of the maximum thickness moves after the velocity gradient (and hence the pressure gradient) in the midchord region decreases. The resultant favorable pressure gradient in the midchord region promotes boundary layer stability and increases the possibility that the boundary layer remains laminar. Laminar boundary layers produce less skin friction drag than turbulent boundary layers but are also more likely to separate under the influence of an adverse pressure gradient.
Trailing-Edge Angle
The trailing edge angle affects the location of the aerodynamic center. The aerodynamic center of this aerofoil sections in a subsonic stream is theoretically located at the quarter chord.

BASIC AEROFOIL TERMS
Wing-Geometry Parameters
By placing the airfoil sections discussed in the preceding section in spanwise combinations, wings, horizontal tails, vertical tails, canards and or other lifting surfaces are formed. When the parameters that characterize the wing planform are introduced, attention must be directed to the existence of flow components in the spanwise direction. In other words, airfoil section properties relate to the resultant flow in three dimensions.
Wing Area
The wing area, is simply the plan surface area of the wing. Although a portion of the area may be covered by fuselage or nacelles, the pressure carry over on these surfaces allows legitimate consideration of the entire plan area. The plan area of the wing including continuation with the fuselage is the ‘gross wing area’. The plan area of the exposed wing (i.e. excluding the continuation within the fuselage) is the ‘net wing area’.
Wing Span
The wing span, is measured tip to tip.
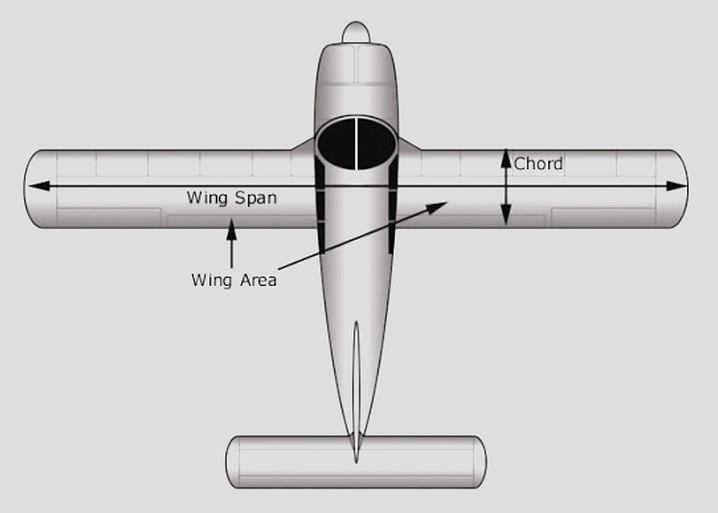
WING AREA & WING SPAN
Average Chord
The average chord, is the geometric average. The product of the span and the average chord is the wing area.
Root Chord
The root chord, is the chord at the wing centre line, and the tip chord, is measured at the tip. Considering the wing planform to have straight lines for the leading and trailing edges, the taper ratio, is the ratio of the tip chord to the root chord. The taper ratio affects the lift distribution and the structural weight of the wing. A rectangular wing has a taper ratio of 1.0 while the pointed tip delta wing has a taper ratio of 0.0.
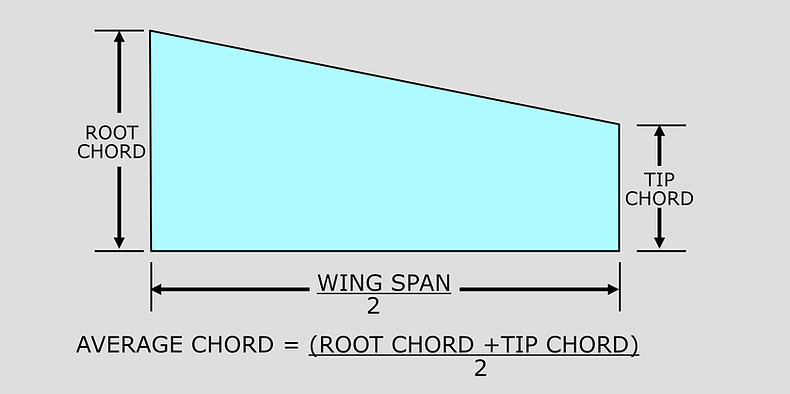
AVERAGE CHORD
Aspect Ratio
The aspect ratio, is the ratio of the span and the average chord. The aspect ratio is a fineness ratio of the wing and is useful in determining the aerodynamic characteristics and structural weight. Typical aspect ratios vary from 35 for a high-performance sailplane to 2 for a supersonic jet fighter.

ASPECT RATIO
Sweep Angle
The sweep angle, is usually measured as the angle between the line of 25 percent chord and a perpendicular to the root chord. Sweep angles of the leading edge or of the trailing edge are often presented with the parameters, since they are of interest for many applications. The sweep of a wing causes definite changes in the maximum lift, in the stall characteristics, and in the effects of compressibility.

SWEEP ANGLE
Mean Aerodynamic Chord
The mean aerodynamic chord, (m.a.c.) represents an average chord which, when multiplied by the product of the average section moment coefficient, the dynamic pressure, and the wing area, gives the moment for the entire wing.
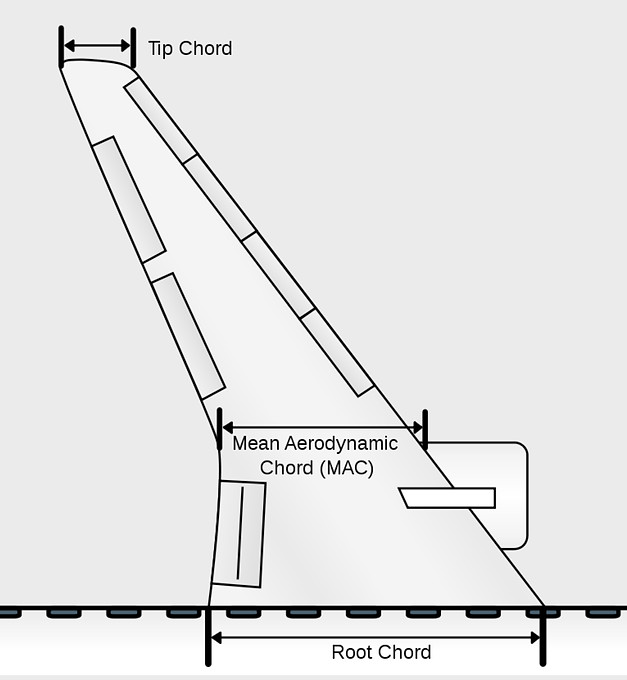
MEAN AERODYNAMIC CHORD (MAC)
Dihedral & Anhedral
The dihedral angle is the angle between a horizontal plane containing the root chord and a plane midway between the upper and lower surfaces of the wing. If the wing lies below the horizontal plane, it is termed an anhedral angle. The dihedral angle affects the lateral stability characteristics of the airplane.

DIHEDRAL VS ANHEDRAL
Geometric Twist
Geometric twist defines the situation where the chord lines for the span wise distribution of airfoil sections do not all lie in the same plane. Thus, there is a span wise variation in the geometric angle of incidence for the sections.
When the incidence of the airfoil sections relative to the vehicle axis decrease toward the tip, the wing has “wash out”. The wings of numerous subsonic aircraft have wash out to control the spanwise lift distribution and, hence, the boundary-layer separation (i.e., stall) characteristics. If the angle of incidence increases toward the tip, the wing has “wash in”.
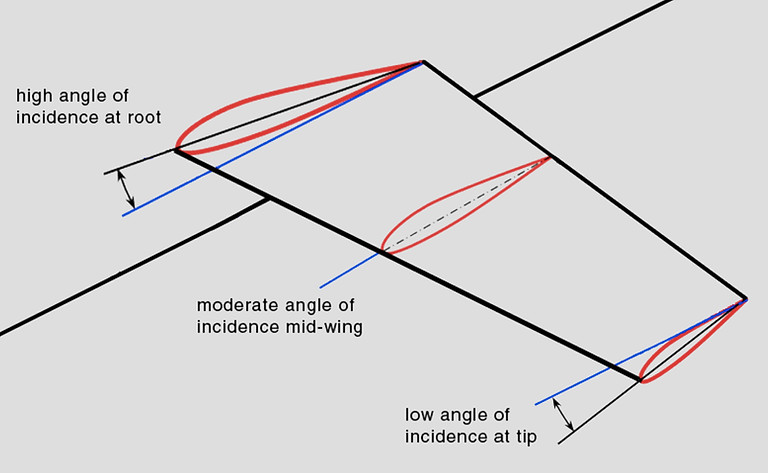
WASH OUT
Lifting Surfaces
If air flows past an aerofoil, a flat plate or indeed almost any shape that is inclined to the direction of flow, we find that the pressure of air on the top surface is reduced while that underneath is increased. This difference in pressure results in a net force on the plate trying to push it both upwards and backwards.
In the case of a simple flat plate, you might imagine that the net force would act at right angles to the plate. This is not so, because there is also a tangential force caused by the different pressures that act on the small leading and trailing edge face areas. This tangential force though small, is by no means negligible.
Rather surprisingly, the pressure at the leading edge is normally very low, and at small angles of inclination, the tangential force will act in the direction. Note, that although the tangential force may be directed towards the front of the plate, the resultant of the tangential and normal forces must always be tilted back relative to the local flow direction.
Lift
The resultant or net force on the lifting surface may be conveniently split into two components relative to the airflow direction as follows -
1. The component at right angles to the direction of the airflow, called LIFT.
2. The component parallel to the direction of the airflow, called DRAG.

LIFT & DRAG
Airflow and pressure over aerofoil
It was soon discovered that a much greater lift, especially when compared with the drag, could be produced by using a curved surface instead of a flat one, and thus the modern aerofoil was evolved. The curved surface had the additional advantage that it provided a certain amount of thickness which was necessary for structural strength. Experiments have shown that the air flows over an aerofoil much more smoothly than over a flat plate.
The flow of air over a typical aerofoil, the following results are achieved
-
There is a slight upflow before reaching the aerofoil.
-
There is a downflow after passing the aerofoil. This downflow should not be confused with the downwash produced by the trailing vortices.
-
The air does not strike the aerofoil cleanly on the nose, but actually divides at a point just behind it on the underside.
-
The streamlines are closer together above the aerofoil where the pressure is decreased.
This last fact is at first puzzling, because, as in the venturi tube, it may lead us to think that the air above the aerofoil is compressed, and that therefore we should expect an increased pressure.
The explanation is that the air over the top surface acts as though it were passing through a kind of bottleneck, similar to a venturi tube, and that therefore its velocity must increase at the narrower portions, i.e. at the highest points of the curved aerofoil. The increase in kinetic energy due to the increase in velocity is accompanied by a corresponding decrease in static pressure. This is, in fact, an excellent example of Bernoulli’s Theorem.
Another way of looking at it is to consider the curvature of the streamlines. In order that any particular particle of air may be deflected on this curved path, a force must act upon it towards the centre of the curve, so that it follows that the pressure on the outside of the particle must be greater than that on the inside; in other words, the pressure decreases as we move down towards the top surface of the aerofoil. This point of view is interesting because it emphasises the importance of curving the streamlines.
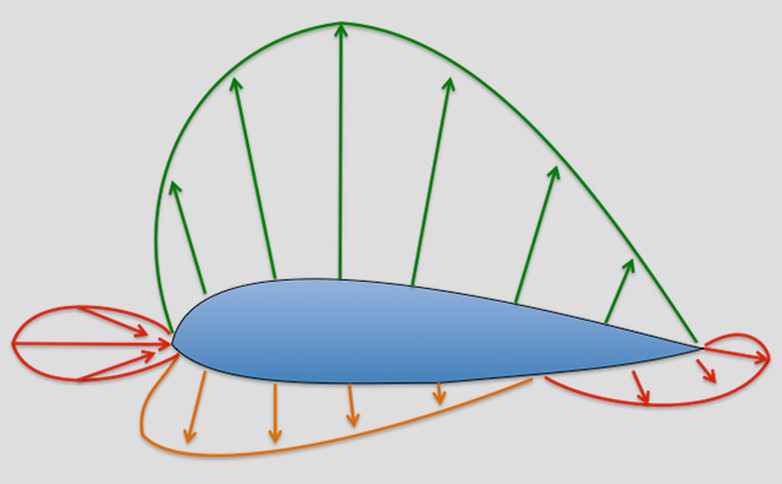
PRESSURE OVER A WING
Chord line and Angle of Attack
It has already been mentioned that the angle of inclination to the airflow is of great importance. On a curved aerofoil it is not particularly easy to define this angle, since we must first decide on some straight line in the aerofoil section from which we can ensure the angle to the direction of the airflow.
Unfortunately, owing to the large variety of shapes used as aerofoil sections it is not easy to define this chord line to suit all aerofoils. Nearly all modern aerofoils have a convex under-surface; and the chord must be specially defined, although it is usually taken as the line joining the leading edge to the trailing edge. This is the centre in the particular case of symmetrical aerofoils. We call the angle between the chord of the aerofoil and the direction of the airflow the angle of attack.
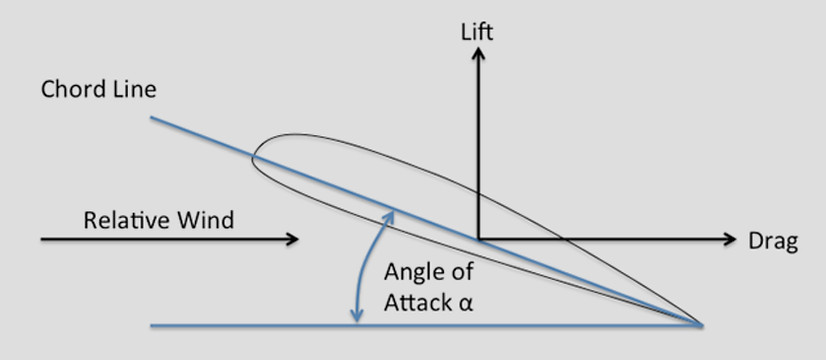
CHORD LINE & ANGLE OF ATTACK
Line of zero lift
Now an aerofoil may provide lift even when it is inclined at a slightly negative angle to the airflow. And one may well ask how an aerofoil which is inclined at a negative angle can produce lift? The idea seems absurd, but the explanation of the riddle is simply that the aerofoil is not really inclined at a negative angle. Our curious chord may be at a negative angle, but the curved surfaces of the aerofoil are inclined at various angles, positive and negative, the net effect being that of a slightly positive angle, which produces lift.
If we tilt the nose of the aerofoil downwards until it produces no lift, it will be in an exactly similar position to that of a flat plate placed edgewise to the airflow and producing no lift, and if we now draw a straight line through the aerofoil parallel to the airflow it will be the inclination of this line which settles whether the aerofoil provides lift or not.
Such a line is called the line of zero lift or neutral lift line, and would in some senses be a better definition of the chord line, but it can only be found by wind tunnel experiments for each aerofoil, and, even when it has been found, it is awkward from the point of view of practical measurements.
Nor is it of much significance in practical flight, except perhaps in a dive when the angle of attack may approach the no lift condition.
Note that for an aerofoil of symmetrical shape zero lift corresponds to zero angle of attack.
Pressure plotting
As the angle of attack is altered the lift and drag change very rapidly, and experiments show that this is due to changes in the distribution of pressure over the aerofoil. These experiments are carried out by the method known as ‘pressure plotting’, in which small holes in the aerofoil surface are connected to glass manometer tubes containing water or other liquid; where there is a suction on the aerofoil the liquid in the corresponding tubes is sucked up, where there is an increased pressure the liquid is depressed. Such experiments have been made both on models in wind tunnels and on aeroplanes in flight, and the results are most interesting and instructive.
Nowadays, simple glass manometers are seldom used for ‘pressure plotting’ purpose except in elementary teaching laboratories. For more serious research work, pressure transducers are employed. These are devices that produce an electrical output that is proportional to the applied pressure. The output from such transducers may then be fed through an interface to a computer. The tedious process of reading the pressures and plotting the distribution can then be left to the computer which may also be used to calculate the resulting lift and pitching moment.
Lift Curve
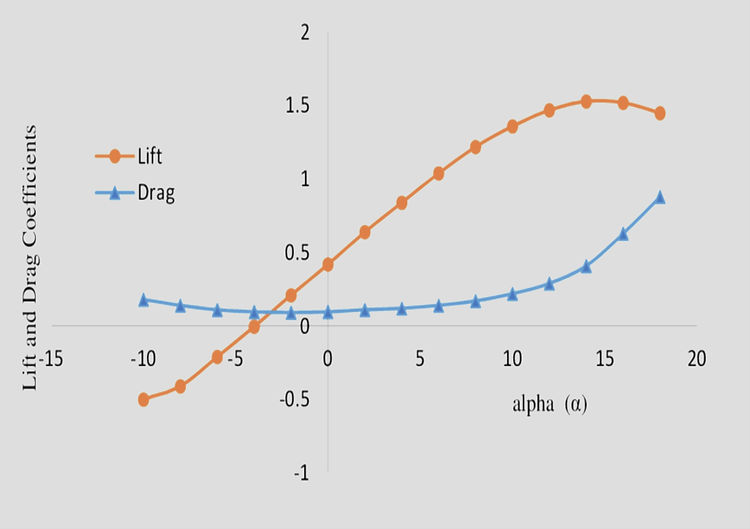
When the angle of attack has reached 0 deg there is already a definite lift coefficient and therefore a definite lift; this is a property of most cambered aerofoils. A flat plate, or a symmetrical aerofoil, will of course give no lift when there is no angle of attack.
Then between 0 deg and about 12 deg the graph is practically a straight line, meaning that as the angle of attack increases there is a steady increase in the lift; whereas above 12 deg, although the lift still increases for a few degrees, the increase is now comparatively small and the graph is curving to form a top, or maximum point.
At about 15 deg the lift coefficient reaches a maximum, and above this angle it begins to decrease, the graph now curving downwards.
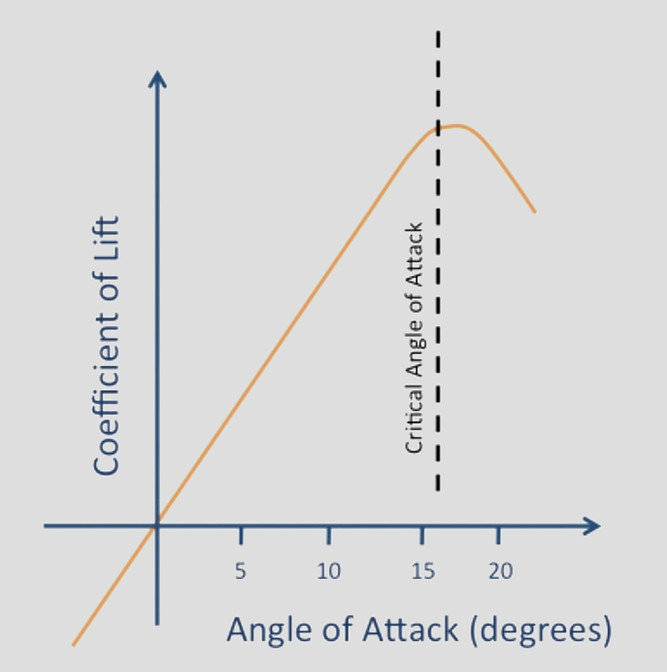
LIFT CURVE
Stalling
At small angles any increase in the angle at which the aerofoil strikes the air will result in an increase in lift, when a certain angle is reached any further increase of angle will result in a loss of lift.
This angle is called the stalling angle of the aerofoil, and, rather curiously, perhaps, we find that the shape of the aerofoil makes little difference to the angle at which this stalling takes place, although it may affect considerably the amount of lift obtained from the aerofoil at that angle.
When the critical angle of about 15-16 deg is reached, there is a complete change in the nature of the flow of the air. The airflow breaks away or separates from the top surface forming vortices similar to those behind a flat plate placed at right angles to the wind; there is therefore very little lift. The streamline flow has broken down and what is called separation or ‘stalling’ has taken its place, with consequent loss in lift.
The stalling angle, then, is that angle of attack at which the lift coefficient of an aerofoil is a maximum, and beyond which it begins to decrease owing to the airflow becoming separated instead of streamlined.
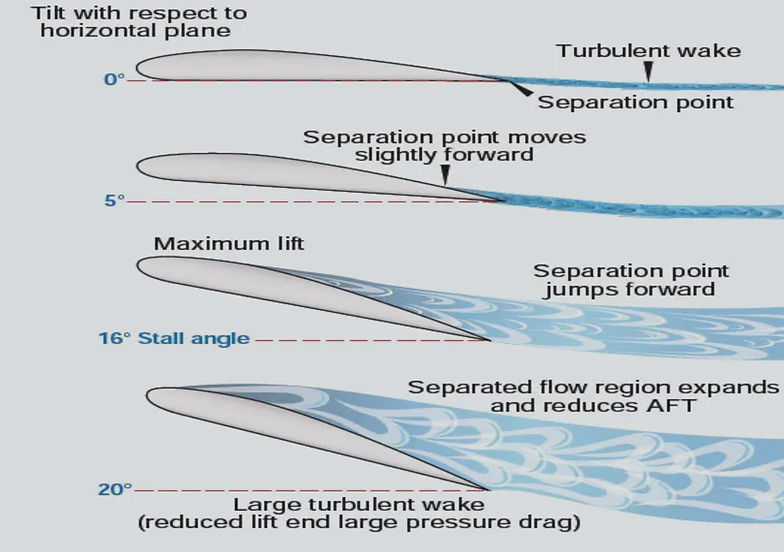
STALLING
Aerodynamic Forces & Moment of Coefficients
Centre of pressure
The decreases and increases of pressure are greatest near the leading edge of the aerofoil - means that if all the distributed forces due to pressure were replaced by a single resultant force, this single force would act less than halfway back along the chord. The position on the chord at which this resultant force acts is called the centre of pressure. The idea of a centre of pressure is very similar to that of a centre of gravity of a body whose weight is unevenly distributed.
Total resultant force on an aerofoil
If we add up the distributed forces due to pressure over an aerofoil, and replace it by the total resultant force acting at the centre of pressure, we find that this force is not at right angles to the chord line nor at right angles to the flight direction. Near the tips of swept wings it can sometimes be inclined forward relative to the latter line due to rather complicated three dimensional effects, but over most of the wing, and on average, it must always be inclined backwards, otherwise we would have a forwards component, or negative drag, and hence perpetual motion.
Although the force must on average be inclined backwards relative to the flight direction it can often be inclined forwards relative to the chord line normal.

CENTRE OF PRESSURE
Movement of centre of pressure
As the angle of attack is altered the distribution of pressure over the aerofoil changes considerably, and in consequence there will be a movement of the centre of pressure. The position of the center of pressure is usually defined as being a certain proportion of the chord from the leading edge.
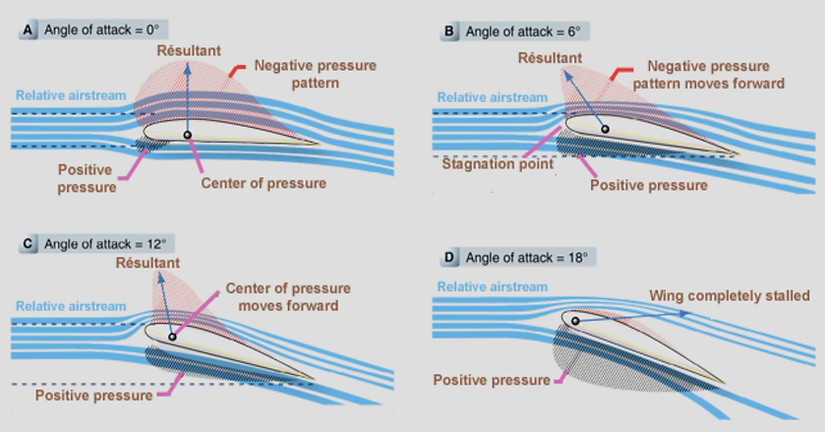
MOVEMENT OF CENTRE OF PRESSURE
It will be noticed that at a negative angle, and even at 0 deg , the pressure on the upper surface near the leading edge is increased above normal, and that on the lower surface is decreased, which means that this portion of the aerofoil is being pushed downwards, while the rear portion is being pushed upwards, so that the whole aerofoil tends to turn over nose first.
So, even at the angle of zero lift, when the upward and downward forces are equal, there is a nose-down pitching
movement on the aerofoil; this is a matter of considerable significance. Putting it another way, at these negative angles the centre of pressure is a long way back - the only place where we could put one force which would have the same moment or turning effect as the distributed pressure would be a long way behind the trailing edge, in fact at zero lift it could not provide a pitching moment at all unless it were an infinite distance back - which is absurd.
Perhaps a more sensible way of putting it is to say that there is a couple acting on the aerofoil, and a couple has no resultant and has the same moment about any point.
As the angle of attack is increased up to 12 deg , the centre of pressure gradually moves forward until it is less than one third of the chord from the leading edge; above this angle it begins to move backwards again. Now during flight, the angle of attack is usually between 2 deg and 8 deg and is very rarely below 0 deg or above 12 deg . So, for the ordinary angles of flight, as the angle of attack of the aerofoil is increased, the centre of pressure tends to move forward.
Lift a poker at its centre of gravity and it will lie horizontal; move the position at which you lift it forwards towards the knob and the rear end of the poker will drop: this is because the centre of lift has moved forwards as compared with the centre of gravity. Therefore if the aerofoil is in balance or ‘trimmed’ at one angle of attack, so that the resultant force passes through the centre of gravity, then the forward movement of the centre of pressure on the aerofoil as the angle of attack is increased will tend to drop still farther the trailing edge of the aerofoil; in other words, the angle of attack will increase even more, and this will in turn cause the centre of pressure to move farther forward, and so on. This is called instability, and it is one of the problems of flight.
If we were to take the wing off a model aeroplane and try to make it glide without any fuselage or tail, we would find that it would either turn over nose first or its nose would go up in the air and it would turn over onto its back. This is because the wing is unstable, and although we might be able to weight it so that it would start on its glide correctly, it would very soon meet some disturbance in the air which would cause it to turn over one way or the other.
Curiously enough, in the case of a flat plate, an increase of the angle of attack over the same angles causes the centre of pressure to move backwards; this tends to dip the nose of the plate back again to its original position, and so makes the flat plate stable. For this reason it is possible to take a flat piece of stiff paper or cardboard, and, after properly weighting it, to make it glide across the room. If it is not weighted the centre of pressure will always be in front of the centre of gravity, and this will cause the piece of paper to revolve rapidly.
The unstable movement of the centre of pressure is a disadvantage of the ordinary curved aerofoil. Attempts have been made to devise aerofoil shapes which have not got this unpleasant characteristic, and it has been found possible to design an aerofoil in which the centre of pressure remains practically stationary over the angles of attack used in ordinary flight. The chief feature in such aerofoils is that the under-surface is convex, and that there is sometimes a reflex curvature towards the trailing edge; nearly all modern aerofoil sections have in fact got convex camber on the lower surface. Unfortunately, attempts to improve the stability of the aerofoil may often tend to spoil other important characteristics.
Pitching Moment of an aerofoil
Now the ultimate object of the aerofoil is to obtain the lift necessary to keep the aeroplane in the air; in order to obtain this lift it must be propelled through the air at a definite velocity and it must be set at a definite angle of attack to the flow of air past it. We have already discovered that we cannot obtain a purely vertical force on the aerofoil; in other words, we can only obtain lift at the expense of a certain amount of drag.
The latter is a necessary evil, and it must be reduced to the minimum so as to reduce the power required to pull the aerofoil through the air, or alternatively to increase the velocity which we can obtain from a given engine power.
The lift, drag and pitching moment of an aerofoil depend on:
-
The shape of the aerofoil
-
The plan area of the aerofoil
-
The square of the velocity
-
The density of the air
Aerofoil characteristics
The easiest way of setting out the results of experiments on aerofoil sections is to draw curves showing how -
-
the lift coefficient
-
the drag coefficient
-
the ratio of lift to drag
-
the position of the centre of pressure, or the pitching moment coefficient, alter as the angle of attack is increased over the ordinary angle of flight.
It is much more satisfactory to plot the coefficients of lift, drag and pitching moment rather than the total lift, drag and pitching moment, because the coefficients are practically independent of the air density, the scale of the aerofoil and the velocity used in the experiment, whereas the total lift, drag and moment depend on the actual conditions at the time of the experiment.
In other words, suppose we take a particular aerofoil section and test it on different scales at different velocities in various wind tunnels throughout the world, and also full-scale in actual flight, we should in each case obtain the same curves showing how the coefficients change with angle of attack.
Drag Curve
The drag is least at about 0 deg, or even a small negative angle, and increases on both sides of this angle; up to about 6 deg, however, the increase in drag is not very rapid, then it gradually becomes more and more rapid, especially after the stalling angle when the airflow separates.
DRAG CURVE
The Lift/Drag ratio curve
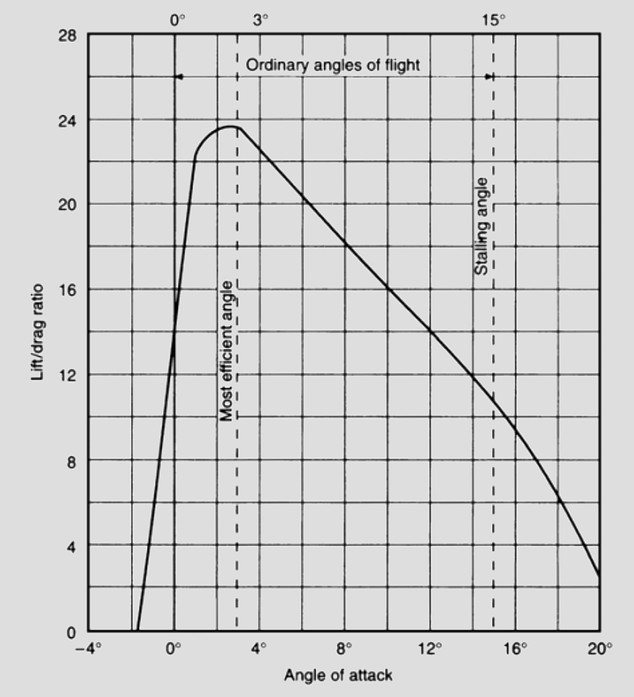
The Lift/Drag Ratio curve shows the relation between the lift and drag at various angles of attack.
If we want as much lift, but as little drag, as it is possible to obtain from the aerofoil. Now from the lift curve we find that we shall get most lift at about 15 deg , from the drag curve least drag at about 0 deg , but both of these are at the extreme range of possible angles, and at neither of them do we really get the best conditions for flight, i.e. the best lift in comparison to drag, the best lift/ drag ratio.
LIFT/DRAG CURVE
The lift/drag ratio increases very rapidly up to about 3 deg or 4 deg , at which angles the lift is nearly 24 times the drag (some aerofoils give an even greater maximum ratio of lift to drag); the ratio then gradually falls off because, although the lift is still increasing, the drag is increasing even more rapidly, until at the stalling angle the lift may be only 10 or 12 times as great as the drag, and after the stalling angle the ratio falls still further until it reaches 0 at 90 deg .
The chief point of interest about the lift/drag curve is the fact that this ratio is greatest at an angle of attack of about 3 deg or 4 deg; in other words, it is at this angle that the aerofoil gives its best all-around results - i.e. it is most able to do what we chiefly require of it, namely to give as much lift as possible consistent with a small drag.
Aerodynamic Centre
For if about the leading edge there is a steady increase, and about a point near the trailing edge a steady decrease in the nose-down pitching moment, there must be some point on the chord about which there is no change in the pitching moment as the angle of attack is increased, about which the moment remains at the small negative nose-down value that it had at the zero lift angle. This point is called the aerodynamic centre of the wing.
So we have two possible ways of thinking about the effects of increase of angle of attack on the pitching moment of an aerofoil, or later of the whole aeroplane; one is to think of the lift changing, and its point of application (centre of pressure) changing; the other is to think of the point of application (aerodynamic centre) being fixed, and only the lift changing.
Both are sound theoretically; the conception of a moving centre of pressure may sound easier at first, but for the aircraft as a whole it is simpler to consider the lift as always acting at the aerodynamic centre. In both methods we really ought to consider the total force rather than just the lift, but the drag is small in comparison and, for most purposes, it is sufficiently accurate to consider the lift alone.
At subsonic speeds the aerodynamic centre is usually about one-quarter of the chord from the leading edge, and theoretical considerations confirm this. In practice, however, it differs slightly according to the aerofoil section, usually being ahead of the quarter-chord point in older type sections, and slightly aft in more modern low drag types.

AERODYNAMIC CENTRE
Drag
Whenever a body is moved though air, or other viscous fluid, there is produced a definite resistance to its motion. In aeronautical work this resistance is usually referred to as drag.
And efforts must be made to reduce the resistance of every part of an aeroplane to a minimum, provided strength and other essential factors can be maintained. For this reason many thousands of experiments have been carried out to investigate the problems of air resistance; in fact, in this, as in almost every branch of this subject, our knowledge is founded mainly on the mean results of accumulated experimental data.
Experiments on air resistance have performed in two ways-
-
By study of the nature of the flow of air and other fluids past solid bodies.
-
By measuring the actual forces produced on the bodies by the passage of the fluid.
The data produced by these two methods show that there is a direct connection between the two, and generally speaking, it can be said that the greater the formation of eddies, or turbulence the greater is the resistance too the passage of aircraft through air.
In experimental work it is usual to allow the fluid to flow past the body rather than to move the body through the fluid. The former method has the great advantage that the body is at rest, and consequently the measurement of any forces upon it is comparatively simple. Furthermore, since we are only concerned with the relative motion of the body and the fluid, the true facts of the case are fully reproduced provided we can obtain a flow of the fluid which would be as steady as the corresponding motion of the body through the fluid.
Types of Drags
Lines which show the direction of the flow of the fluid at any particular moment are called streamlines, and a body so shaped as to produce the least possible eddy or vortex motion is said to be of streamline shape. By introducing smoke into the airflow in wing tunnels, and coloured jets into water tank experiments.
The results of these experiments show that we may divide the resistance of a body passing through a fluid into two parts:
-
Form Drag
-
Skin Friction.
These two between then form a large part of the total drag of an aeroplane in the high subsonic range, the major part.
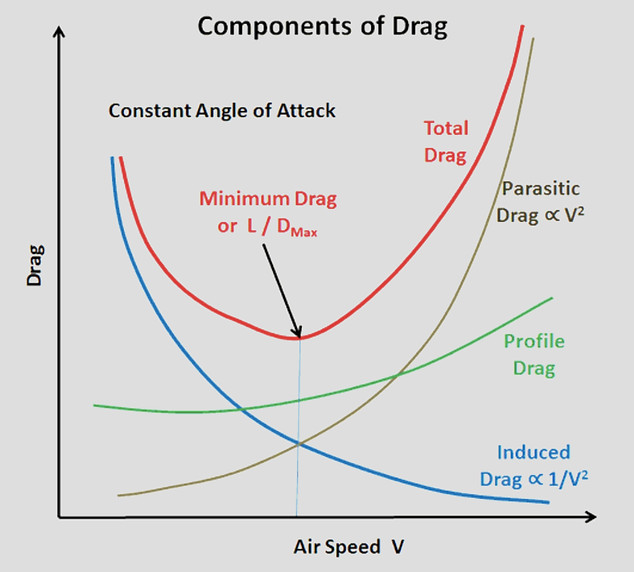
The total drag of an aeroplane is sometimes divided in another way in which the drag of the wings or lifting surfaces, wing drag, is separated from the drag of those parts which do not contribute towards the lift, the drag of the latter being called parasite drag.
TYPES OF DRAGS
Profile drag
This is the portion of the resistance which is due to the fact that when a viscous fluid flows past a solid object, vortices are formed, and we no longer get a smooth streamline flow. The extreme example of this type of resistance is a flat plate placed at right angles to the wind. The resistance is very large and is almost entirely due to the formation of vortices, the skin fiction being negligible in comparison.
Experiments show that not only is the pressure in front of the plate greater than the atmospheric pressure, but that the pressure behind is less than that of the atmosphere, causing a kind of “sucking” effect on the plate. This is ‘the drag arising from the resolved components or the tangential stresses on the surface of the body. At all points on the surface of a body past which a viscous fluid is flowing there is a traction along the surface in the direction of flow. This traction is due directly to viscosity.
The traction at each point has a component acting in the direction of the undisturbed stream (or in the direction opposite to the direction of the opposite to the direction of flight). The total effect of these components, taken over the whole of the exposed surface of the body, is the surface friction drag (skin-friction drag).
Surface friction drag cannot exist in an inviscid fluid.
Form drag reduction by streamlining
Form drag is kept to a minimum by preventing boundary-layer separation. Streamlining is vitally important for reducing form drag. It is worth noting that at high Reynolds numbers a circular cylinder has roughly the same overall drag as a streamlined aerofoil with a chord length equal to 100 cylinder radii. Form drag is overwhelmingly the main contribution to the overall drag for bluff bodies like the cylinder, whereas the predominant contribution in the case of the streamlined body is skin-friction drag, form drag being less than ten percent of the overall drag. For bluff bodies even minimal streamlining can be very effective.
Skin friction drag reduction by smoothing the surface
In broad terms skin-friction drag can be reduced in one of two ways. Either laminar flow is maintained by postponing transition, this is the so-called laminar-flow technology, or ways are found to reduce the surface shear stress generated by the turbulent boundary layer.
Laminar flow can be maintained passively by prolonging the favourable or constant-pressure region over the wing surface. Active control of transition requires the use of suction, either distributed or through discrete spanwise slots. Often the suction is used in conjunction with favourable pressure distributions.
The basic principles of maintaining laminar flow by means of suction have been known for at least the past thirty-five to forty years. However, problems with practical implementation on aircraft, either real or perceptual, have prevented the widespread use of the technology.
Induce Drag
The trailing vortices which are shed from near the tips of a finite wing contain energy associated with the rotational velocities. This energy is abstracted from the airflow, so that some power must equal the rate of flow of energy associated with the trailing vortices. This is equivalent to saying that there is now a further drag force on the wing, to be added to its profile drag. This is known as induced drag, and it forms a very important part of the total drag of a finite wing.
Boundary Layer Drag (Profile Drag)- the boundary layer drag is the sum of the surface friction drag and the boundary layer normal-pressure drag (form drag).
To reduce induced drag: Saw tooth or dog tooth leading edge
The induced drag falls as the aspect ratio of the wing is increased and for a given aspect ratio elliptic-shaped wings have the lowest induced drag. Over the past fifteen years the winglet has been developed as a device for reducing induced drag without increasing aspect ratio.
On all subsonic wings there is a tendency for a secondary flow to develop from the high-pressure region below the wing round the wing tip to the relatively low pressure region on the upper surface. This is part of the process of forming the trailing vortices. If a winglet of the appropriate design and orientation is fitted to the wing-tip, the secondary flow causes the winglet to be at an effective angle of incidence, giving rise to lift and drag components LW and DW have components in the direction of the drag of the aircraft as a whole. LW provides a component counter to the aircraft drag, while DW provides a component which augments the aircraft drag. For a well-designed winglet the contribution of LW predominates, resulting in a net reduction in overall drag, or a thrust, equal to zero.
Wing let and Wing fence
Ideally, air would always flow chordwise over a wing; however, air will tend to flow spanwise toward the tip. Spanwise flow is particularly a problem on swept wings. This spanwise flow of air may be partially controlled by the use of a wing (flow) fence, wing fence is a stationary vane, projecting from the upper surface of an airfoil, which is used to prevent the spanwise flow of air. Flow fences are often located in alignment with trailing-edge control surfaces, such as ailerons, to improve the chordwise flow and thereby the effectiveness of the control surfaces.

CONVENTIONAL WINGTIP VS WINGLET

TYPES OF WINGLETS
Interference Drag
In general, with any aircraft configuration, there is, in addition to the drag of the drag of the various components, an extra amount of drag due to interference between these components. Principally between wing and the fuselage. This is especially important at high speeds. Experiment shows that a large part of the transonic drag rise for a complete aircraft is due to interference. It also shows that interference drag at transonic speeds may be minimized by ensuring that the distribution along the length of the aircraft axis of its total cross-sectional area follows a certain smooth pattern.
There is an optimum area distribution, and the minimization of transonic interference drag requires that the aircraft should be designed to fit this distribution as closely as possible. This requirement is known as the transonic area rule. In practice, of course, no aircraft has this optimum distribution, but any reasonably smooth area distribution helps to keep down the transonic drag rise.
Wave Drag
The sudden extra drag which is such a marked feature of the shock stall has two main components. First the energy dissipated in the shock wave itself is reflected in additional drag (wave drag) on the aerofoil. Secondly, the shock wave may be accompanied by separation, or at any rate a thickening of and increase in turbulence level in the boundary layer.
Either of these will modify both the pressure on the surface and the skin friction behind the shock wave. So this shock drag may be considered as being made up of two parts, i.e. the wave- making resistance, or wave drag, and the drag caused by the thick turbulent layer or region of separation which we will call boundary layer drag.
As the shock wave and the thickened turbulent boundary layer or separation are like the chicken and the egg-we do not know which comes first; what we do know is that when one comes so does the other. That is not to say that they are by any means the same thing, or that they have the same effects, or that a device which reduces one will necessarily reduce the other.
Parasite drag
The other components of the aircraft, e.g., the fuselage, engine nacelles, tail unit, etc., contribute an additional mount of drag. Since these components are ‘non-lifting’, i.e., they do not contribute significantly to the useful lift of the aircraft, this drag is called “parasite drag”. The parasite drag coefficient is often assumed to be constant